How to get started with Calculation Groups?
- Kavita Behera
- Sep 27, 2021
- 3 min read

Updated: Sep 28, 2021
Calculation groups are well-known in the Power BI world. I recently used it for a variety of tasks, and here's a fast rundown of everything you need to know if you're using it for the first time.
Calculation groups limit the number of repetitive measures while increasing their effectiveness. Let's say I have production data and I need the amount of sales, the cost, and the profit in percentages of the total. To do so, I must select all three fields for each table, bar chart, or other visual. This is a simple example, and the manual version doesn't take long, but you get the idea; with groups, this minimal manual work can be minimized as well.
Software required:
1) Power BI Desktop (Installed)
2) Tabular Editor (Installed)
In this example, I will use the most popular use case of Calculated groups which is Time intelligence feature. Writing YoY, QoQ, MoM % for multiple numeric column include a lot of repetitive activity.
Use a financial based data which should have at least 2 different numeric column. Like Cost and Sales in my case. Below are the steps you should follow:
The first step is to make sure both programmes are installed and running on your computer.
As a general guideline, anytime we need to calculate a large number of time intelligence measures, we should create a separate Date ID table. Your measures will not function correctly without it.
Make a Date ID tablet with all of the columns you'll need. Below is a DAX function that will assist you in creating the table.For more details watch this great video
Date =
 ADDCOLUMNS (
 CALENDAR (DATE(2000;1;1); DATE(2025;12;31));
 "DateAsInteger"; FORMAT ( [Date]; "YYYYMMDD" );
 "Year"; YEAR ( [Date] );
 "Monthnumber"; FORMAT ( [Date]; "MM" );
 "YearMonthnumber"; FORMAT ( [Date]; "YYYY/MM" );
 "YearMonthShort"; FORMAT ( [Date]; "YYYY/mmm" );
 "MonthNameShort"; FORMAT ( [Date]; "mmm" );
 "MonthNameLong"; FORMAT ( [Date]; "mmmm" );
 "DayOfWeekNumber"; WEEKDAY ( [Date] );
 "DayOfWeek"; FORMAT ( [Date]; "dddd" );
 "DayOfWeekShort"; FORMAT ( [Date]; "ddd" );
 "Quarter"; "Q" & FORMAT ( [Date]; "Q" );
 "YearQuarter"; FORMAT ( [Date]; "YYYY" ) & "/Q" & FORMAT ( [Date]; "Q" )
Create all of the essential measures for any one column, either cost or sales, once the table is complete.
I calculated QoQ percent, YoY percent, MoM percent, and Previous Value in my situation. The DAX function is listed below.
Qty = Sum('Table'[Cost])

Year over Year %
YOY% =
Var CurrentValue = [Qty]
Var Previous = CALCULATE([Qty], SAMEPERIODLASTYEAR('Date'[Date]))
Return
IF(ISBLANK(Previous), BLANK(),DIVIDE(CurrentValue-Previous,Previous))

Quarter over Quarter %
QOQ% =
VAR thisQ =
    [Qty]
VAR lastQ =
    CALCULATE (
        [Qty],
        DATESINPERIOD ( 'Date'[Date], MIN ( 'Date'[Date] ), -1, QUARTER )
    )
RETURN
    DIVIDE ( thisQ - lastQ, lastQ, 0 )

Month over Month Percentage
MOM% =
VAR thisM = [Qty]
VAR lastM =
    CALCULATE (
        [Qty],
        DATEADD('Date'[Date],-1,MONTH)
    )
RETURN
   DIVIDE(thisM-lastM,lastM)
Note: I used different functions to show how each one of them can be used for same purpose by changing the syntax slightly. Qty and Date are the 2 fields use consistently.
The Calculation Group is Started
Now Go to external tools and open Tabular editor as shown below:

The Tabular Editor should automatically connect with your dataset. You can check it under tables:

Go to the tables > Right click > Create New> Calculation Group

Rename Group as Time Intelligence > Create New Calculation Item
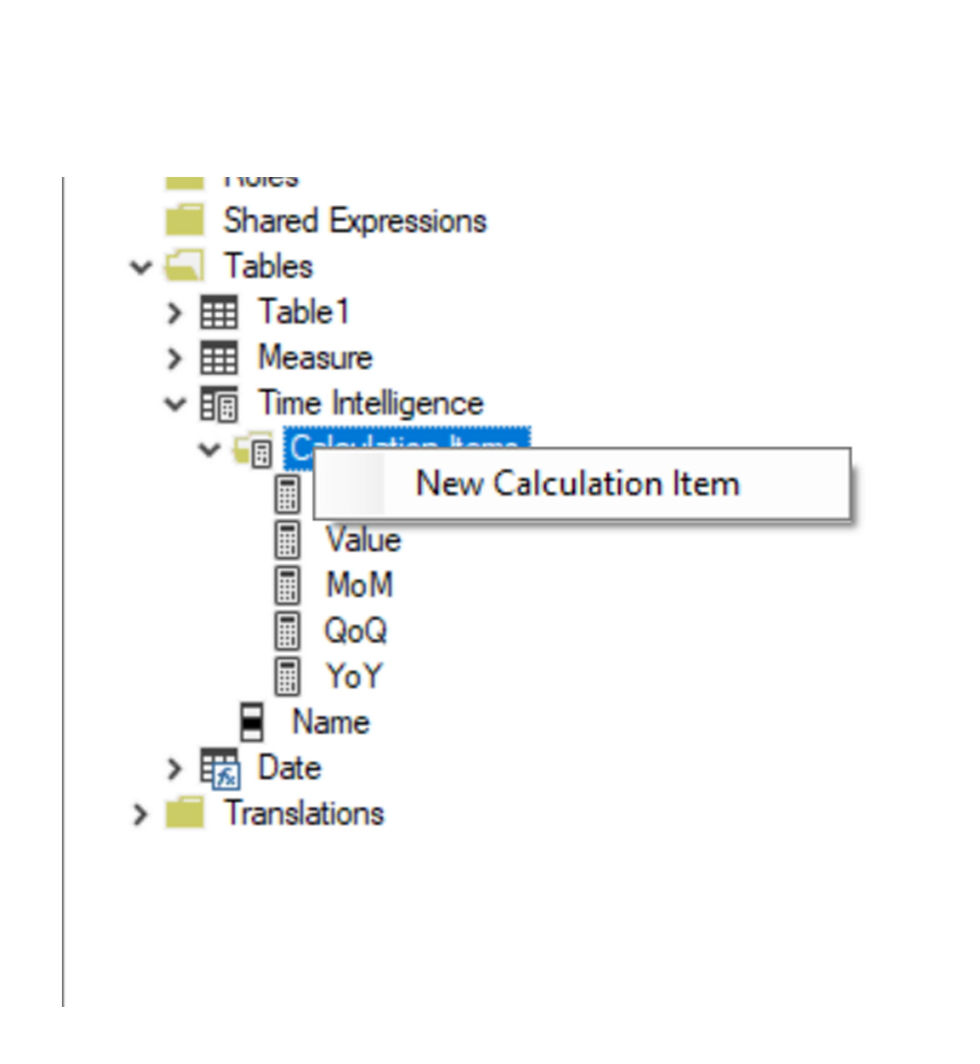
In Expression Editor > Copy Paste the DAX measure we created earlier for MoM%. Keep the same formula but instead of Qty write SELECTED MEASURE (). Selected measure will let you use this same measure for any given field which makes it a one time activity.
Also, change the format string expression into "0.00%" format.

Here you also have Long Line and Short Line formatting option. So you can write your DAX is a neat manner.

As the final step save the Tabular editor work bu CNTRL+S.
Go to Power BI Desktop > Refresh the Model > The Time Intelligence is now visible in model > Use the columns in certain way that values should contain the numeric field and Names on column.
Result: All your groups will be now visible as shown in image is custom format.

If you follow these steps, you will have a dynamic time intelligence field in your dataset that you can use with any column.
Suitability:
1) Column tables are the best visual for displaying and analysing these metrics.
2) If you want to use a visual for a specific measurement. Then, in the filter pane, deselect everything else.
I hope you found this article useful in creating your first calculation group.


Comments